In a previous article we were presenting the features brought by the new release of JIRA. Today, we will focus on the improvements for JIRA system administrators. On high-volume instances, performance has been one of JIRA’s weaknesses for a long time. Atlassian now tries to prove that this time is over!
JIRA 5.1 already brought a huge performance increase (up to 40%), pushing up the recommended 200 000 issues limit to 500 000. Now that this problem is solved, Atlassian has focused on providing their clients with several tools to make the work of JIRA system administrators easier.
Re-indexing JIRA
Re-indexing issues in JIRA has always been painful. There was no way of re-indexing an instance during business hours because it would be unavailable for several minutes (or even hours!), which was hardly acceptable. At the same time, every change to the configuration of JIRA would require a re-index which is quite a contradiction!
JIRA 5.2 removes this paradox by providing a background re-index (the former mode is still available). This process is slower but still allows JIRA users to access their favorite tool. That said, we recommend running this operation on a time window where JIRA is not overly used in order to avoid memory issues (you may have already encountered the well-known OutOfMemoryError!).
HTTP Log analysis
HTTP access logs have been available for JIRA for a long time. They allow you to trace every request between your JIRA instance and each user as well as their processing time. Problem is we didn’t have any easy way to analyze those and you had to extract data yourself, which was not an easy thing to do. Atlassian now provides us with a tool to automatically analyze access logs (see here), the well-named “HTTP requests log analyzer”.
This tool will allow you to categorize all your requests and to extract useful statistics. From a log file analysis, three files will be delivered:
- A .wiki file (to insert into JIRA or Confluence) which displays the distribution of all your requests by categories. You will be able to know where your users are spending most of their time. Frequently, gadgets are the more consuming requests. Hint: tell your users to use a reasonable amount of gadgets on their dashboards in order to improve time response for everyone (it is even truer if a large dashboard is the welcome page of most users).
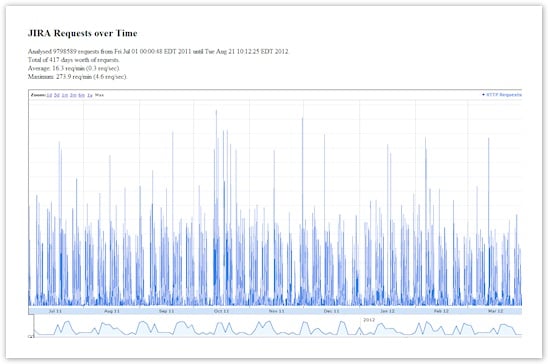
- An .html file which shows a graph of requests through time, interesting to know usage distribution within a day.
- A .txt file which references unknown requests, typically those from plugins that you developed.
Custom fields
We’ve often observed that having a lot of custom fields has harmful effects on performance. Atlassian once fixed an arbitrary limit of 300 customfield by JIRA instance. To prove this, they have done performance tests (results are visible here). Here is the report:
- We can observe a huge performance loss when crossing the 600 custom fields barrier with a global context (for all issues).
- Using custom fields’ context by project, performances are a lot better than using hidden fields (with field configurations).
Even if it is technically possible to have 600 custom fields on one JIRA instance, it can be a pain to maintain for JIRA administrators. We advise you to stay well below that limit, answering some good questions each time a new use case has to be implemented in JIRA: is this field really essential for this process? Can’t I use an existing field (with a new context) instead?
Finally
JIRA 5.2 is the first JIRA version to support the latest versions of Java (1.7) and Tomcat (7.0); you may try these new versions as you upgrade your JIRA instance to 5.2.


